TIRUCHIRAPPALLI

District Profile

Demographic - Census 2011

Total Population: 2722290
Density : 604 per sq.km
Female : 1370006
Male: 1352284
Elderly : 300810
Literates: 2038981(83.23%)
Urban Population: 1338033(49.15%)

Livelihood - Census 2011

Total Main Workers: 1082329
Marginal workers : 131650
Non workers : 1508311
Eco-sensitive aspects: TN wetland Mission
Total wetland area : xxxxx ha
Ramsar sites: xxxxx
Area 4522.04 sq.km , No. of Blocks 6 , No. of Villages 404 , Corporation 1 , Municipalities 3 , Panchayat Unions: 14 , Town Panchayats 16

TIRUCHIRAPPALLI

Land Use / Land Cover

Water Resources
Major River Basin: Agniyar (7.62%), Cauvery (88.44%) and Vellar (3.01%)

Agniyar River Basin - 7.62%
         
Vellar River Basin
3.01%
Major river: Ayyar and Uppar of Cauvery river
Water Systems : 3 dams and 286 tanks
(IWS & PWD, 2017)
Agriculture
Net area sown: xxx ha

Cropping intensity - xxxx %
         
(Agriculture statistics, 2021)
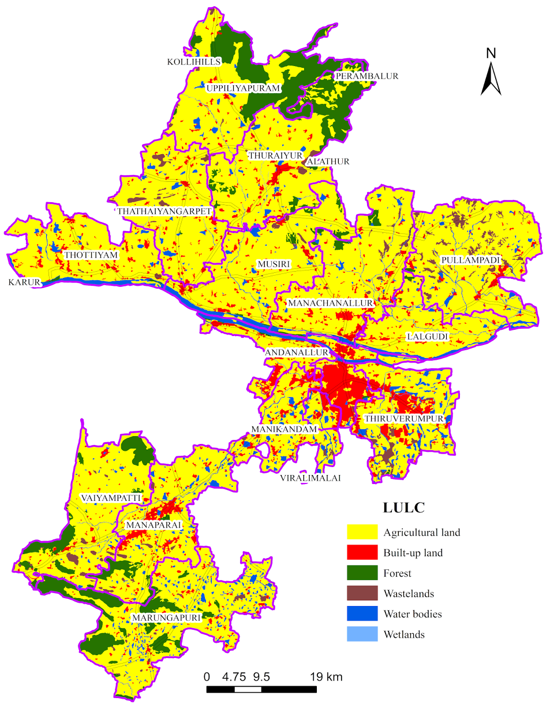
Forests
Moderately Dense Forest: 242.75 sq.km
Very Dense Forest: 53.64 sq.km
(FSI 2021)

         
Sustainable Habitat:
Built up area : 388 sq.km (NRSC, 2015)
Tiruchirappalli Corporation area : 146.90 sq.km
(District Statistical Handbook, 2021-2022)

TIRUCHIRAPPALLI

Temperature Profile

Observed Temperature Trend (1951-2020)

Annual average Maximum Temperature : 33.0 oC
Annual average Minimum Temperature : 23.1 oC
Temperature Projections with reference to baseline:
(1985-2014)

TIRUCHIRAPPALLI

Rainfall Profile

Observed Rainfall Trend (1951-2020)

Annual average Rainfall : 872.9 mm
Rainfall Projections with reference to baseline (1985-2014)

© 2023 Centre for Climate Change and Disater Management, Anna University, All Rights Reserved.
Designed by Ahamed Ibrahim and Asan Basheer, CCCDM