THANJAVUR

District Profile

Demographic - Census 2011

Total Population: 2405890
Density : 705 per sq.km
Female : 1223474
Male: 1182416
Elderly : 258410
Literates: 1790998(82.64%)
Urban Population: 851359(35.39%)

Livelihood - Census 2011

Total Main Workers: 834484
Marginal workers : 139595
Non workers : 1431811
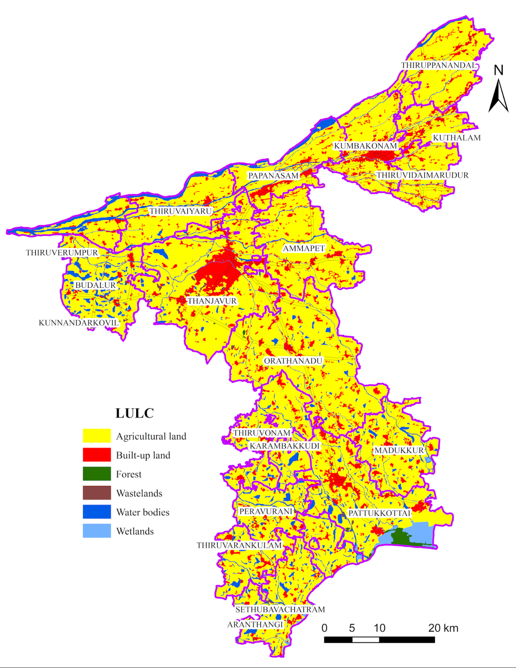
Eco-sensitive aspects: TN wetland Mission
Total wetland area : 22591 ha
Ramsar sites: Dugong Conservation Reserve, Ambuliyar River Mouth
Area 3411 sq.km , No. of Blocks 14 , No. of Villages 589 , Corporation 1 , Municipalities 2 , Panchayat Unions: 14 , Town Panchayats 22

THANJAVUR

Land Use / Land Cover

Water Resources
Major River Basin: Agniyar (35.2%) and Cauvery (64.73%)

Agniyar River Basin - 35.2%
         
Cauvery River Basin
64.73%
Major river: River Kollidam, Kattar, Agniar, and Nasuvini Aar
Water Systems : 750 tanks
(IWS & PWD, 2017)
Agriculture
Net area sown: 195541 ha

Cropping intensity - 154.8 %
         
(Agriculture statistics, 2021)
Forests
Moderately Dense Forest: 11076.94 sq.km
Very Dense Forest: 3591.26 sq.km
(FSI 2021)

         
Sustainable Habitat:
Built up area : 418.98 sq.km (NRSC, 2015)
Nagercoil Corporation area : 36.33 sq.km
(District Statistical Handbook, 2021-2022)

THANJAVUR

Temperature Profile

Observed Temperature Trend (1951-2020)

Annual average Maximum Temperature : 32.9 oC
Annual average Minimum Temperature : 23.7 oC
Temperature Projections with reference to baseline:
(1985-2014)

THANJAVUR

Rainfall Profile

Observed Rainfall Trend (1951-2020)

Annual average Rainfall : 1038.4 mm
Rainfall Projections with reference to baseline (1985-2014)

© 2023 Centre for Climate Change and Disater Management, Anna University, All Rights Reserved.
Designed by Ahamed Ibrahim and Asan Basheer, CCCDM