RAMANATHAPURAM

District Profile

Demographic - Census 2011

Total Population: 1353445
Density : 330 per sq.km
Female : 670787
Male: 682658
Elderly : 132321
Literates: 978946 (80.72%)
Urban Population: 410699 (30.3%)

Livelihood - Census 2011

Total Main Workers: 486150
Marginal workers : 116827
Non workers : 750468
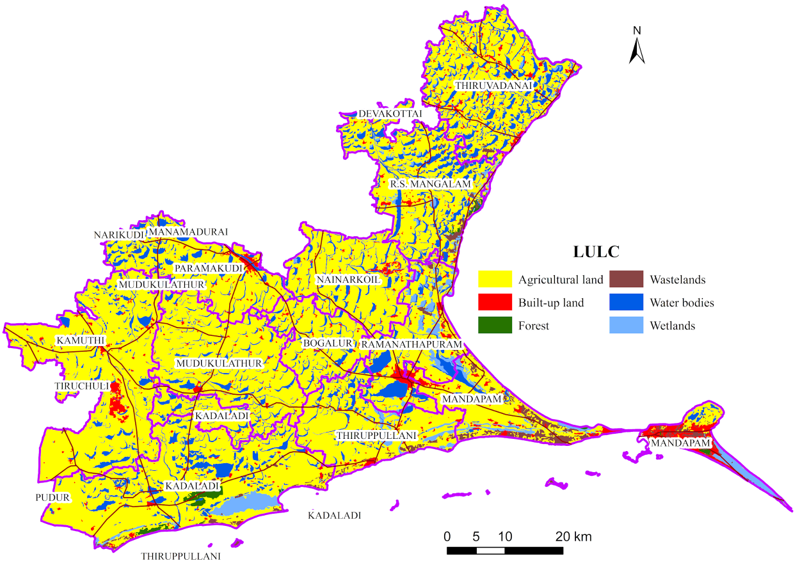
Eco-sensitive aspects: TN wetland Mission
Total wetland area : 73808 ha
Ramsar sites: Chitrangudi Bird Sanctuary, Gulf of Mannar Marine Biosphere Reserve, Kanjirankulam Bird Sanctuary
Area 4104 sq.km , No. of Blocks 11 , No. of Villages 393 , Corporation NIL , Municipalities 3 , Panchayat Unions: 11 ,Town Panchayats 17

RAMANATHAPURAM

Land Use / Land Cover

Water Resources
Major River Basin: Gundar (53.9%), Pambar (25.22%) and Vaigai (18.2%)

Gundar River Basin - 53.9%
         
Pambar River Basin
25.22%
Vaigai River Basin
18.2%
Major river: Sarugani River, Manimuthar River, Vaigai River and Vaippar River
Water Systems : 639 tanks
(IWS & PWD, 2017)
Agriculture
Net area sown: 182951 ha

Cropping intensity - 102.4 %
         
(Agriculture statistics, 2021)
Forests
Moderately Dense Forest: 24.07 sq.km
Very Dense Forest: 0.37 sq.km
(FSI 2021)

         
Sustainable Habitat:
Built up area : 463.81 sq.km (NRSC, 2015)
(District Statistical Handbook, 2021-2022)

RAMANATHAPURAM

Temperature Profile

Observed Temperature Trend (1951-2020)

Annual average Maximum Temperature : 32.2 oC
Annual average Minimum Temperature : 23.2 oC
Temperature Projections with reference to baseline:
(1985-2014)

RAMANATHAPURAM

Rainfall Profile

Observed Rainfall Trend (1951-2020)

Annual average Rainfall : 903.7 mm
Rainfall Projections with reference to baseline (1985-2014)

© 2023 Centre for Climate Change and Disater Management, Anna University, All Rights Reserved.
Designed by Ahamed Ibrahim and Asan Basheer, CCCDM