coimbatore

District Profile

Demographic - Census 2011

Total Population: 34,58,045
Density : 731 per sq.km
Female : 17,28,748
Male: 17,29,297
Elderly : 3,90,005
Literates: 26,35,907 (76.2%)
Urban Population: 2618940 (75.7%)

Livelihood - Census 2011

Total Main Workers: 14,43,252
Marginal workers : 1,24,698
Non workers : 18,90,095
Eco-sensitive aspects: TN wetland Mission
Total wetland area : xxxx ha
Nilgiri Biosphere Reserve 
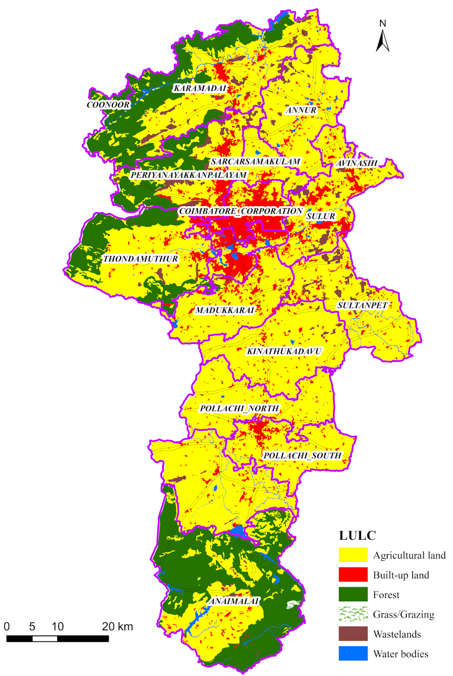
Lakes: Kovaipudur, Sulur, Singanallur, Perur, Ukkadam and Kurichi
Area 4732 sq.km , No. of Blocks 12 , No. of Villages 229 , Corporation 1 , Municipalities 3 , Panchayat Unions: 12 ,Town Panchayats 37

coimbatore

Land Use / Land Cover

Water Resources
Major River Basin: Cauvery River Basin and Parambikulam Aliyar Basin

Cauvery River Basin - 55.19%
         
Parambikulam Aliyar Basin
44.74%
Major river: Bhavani, Noyil and Amaravathi
Water Systems : 6 dams and 51 tanks
(IWS & PWD, 2017)
Agriculture
Net area sown: 166703 ha

Cropping intensity - 105.2 %
         
(Agriculture statistics, 2021)
Forests
Moderately Dense Forest: 672.88 sq.km
Very Dense Forest: 355.96 sq.km
(FSI 2021)

         
Sustainable Habitat:
Built up area : 463.81 sq.km (NRSC, 2015)
Nagercoil Corporation area : 257.04 sq.km
(District Statistical Handbook, 2021-2022)

coimbatore

Temperature Profile

Observed Temperature Trend (1951-2020)

Annual average Maximum Temperature : 32.9 oC
Annual average Minimum Temperature : 23.5 oC
Temperature Projections with reference to baseline:
(1985-2014)

coimbatore

Rainfall Profile

Observed Rainfall Trend (1951-2020)

Annual average Rainfall : 1027.1 mm
Rainfall Projections with reference to baseline (1985-2014)

© 2023 Centre for Climate Change and Disater Management, Anna University, All Rights Reserved.
Designed by Ahamed Ibrahim and Asan Basheer, CCCDM