THENI

District Profile

Demographic - Census 2011

Total Population: 1245899
Density : 434 per sq.km
Female : 620216
Male: 625863
Elderly : 133638
Literates: 870080(77.3%)
Urban Population: 670481 (53.82%)

Livelihood - Census 2011

Total Main Workers: 530591
Marginal workers : 61051
Non workers : 654257
Eco-sensitive aspects: TN wetland Mission
Total wetland area : 5293 ha
Ramsar sites: xxxxx
Area 3242 sq.km , No. of Blocks 8 , No. of Villages 130 , Corporation NIL , Municipalities 6 , Panchayat Unions: 8 , Town Panchayats 22

THENI

Land Use / Land Cover

Water Resources
Major River Basin: Vaigai (99.72%)

Vaigai River Basin - 99.72%
         
Major river: Vaigai River, Suruli Ar, Periyar River and Kottagudi River
Water Systems : 4 dams and 145 tanks
(IWS & PWD, 2017)
Agriculture
Net area sown: 108732 ha

Cropping intensity - 107.0 %
         
(Agriculture statistics, 2021)
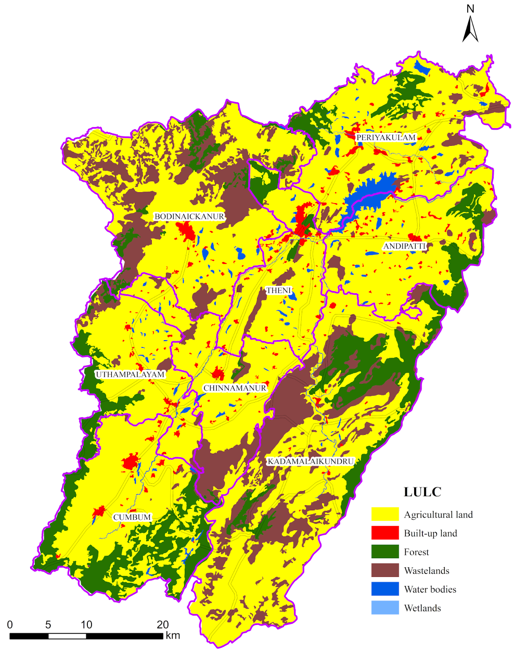
Forests
Moderately Dense Forest: 479.76 sq.km
Very Dense Forest: 177.64 sq.km
(FSI 2021)

         
Sustainable Habitat:
Built up area : 64.19 sq.km (NRSC, 2015)
Corporation area : xxxx sq.km
(District Statistical Handbook, 2021-2022)

THENI

Temperature Profile

Observed Temperature Trend (1951-2020)

Annual average Maximum Temperature : 31.2 oC
Annual average Minimum Temperature : 21.9 oC
Temperature Projections with reference to baseline:
(1985-2014)

THENI

Rainfall Profile

Observed Rainfall Trend (1951-2020)

Annual average Rainfall : 1221.3 mm
Rainfall Projections with reference to baseline (1985-2014)

© 2023 Centre for Climate Change and Disater Management, Anna University, All Rights Reserved.
Designed by Ahamed Ibrahim and Asan Basheer, CCCDM